LATEST

Explained

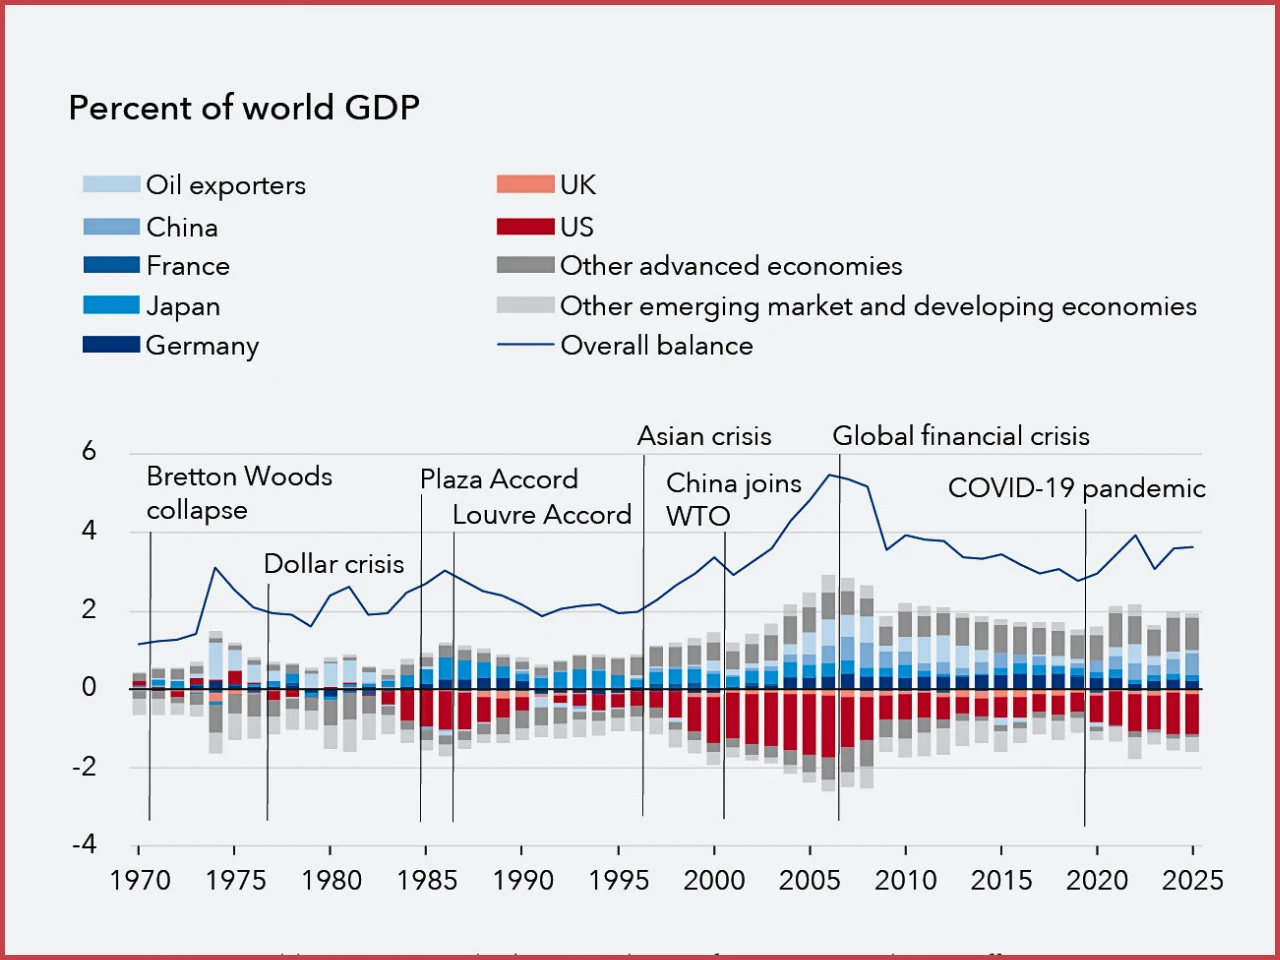
The graph represent global trade imbalance graph
Explained ·May 26, 2026 ·5 min read

IMF: Tariffs and Industrial Subsidies ‘Largely Ineffective’ as Global Trade Imbalances Reverse Post-2008 Gains

The International Monetary Fund warned in a pointed new policy paper that tariffs and industrial subsidies are largely ineffective and damaging to economic welfare, as global trade progress since the 2008 financial crisis has reversed. The IMF says rebalancing requires coordinating domestic macroeconomic reform, not trade barriers, with widening imbalances driven by persistently large deficits in national saving in the United States and China’s ongoing real estate slowdown.

Read article
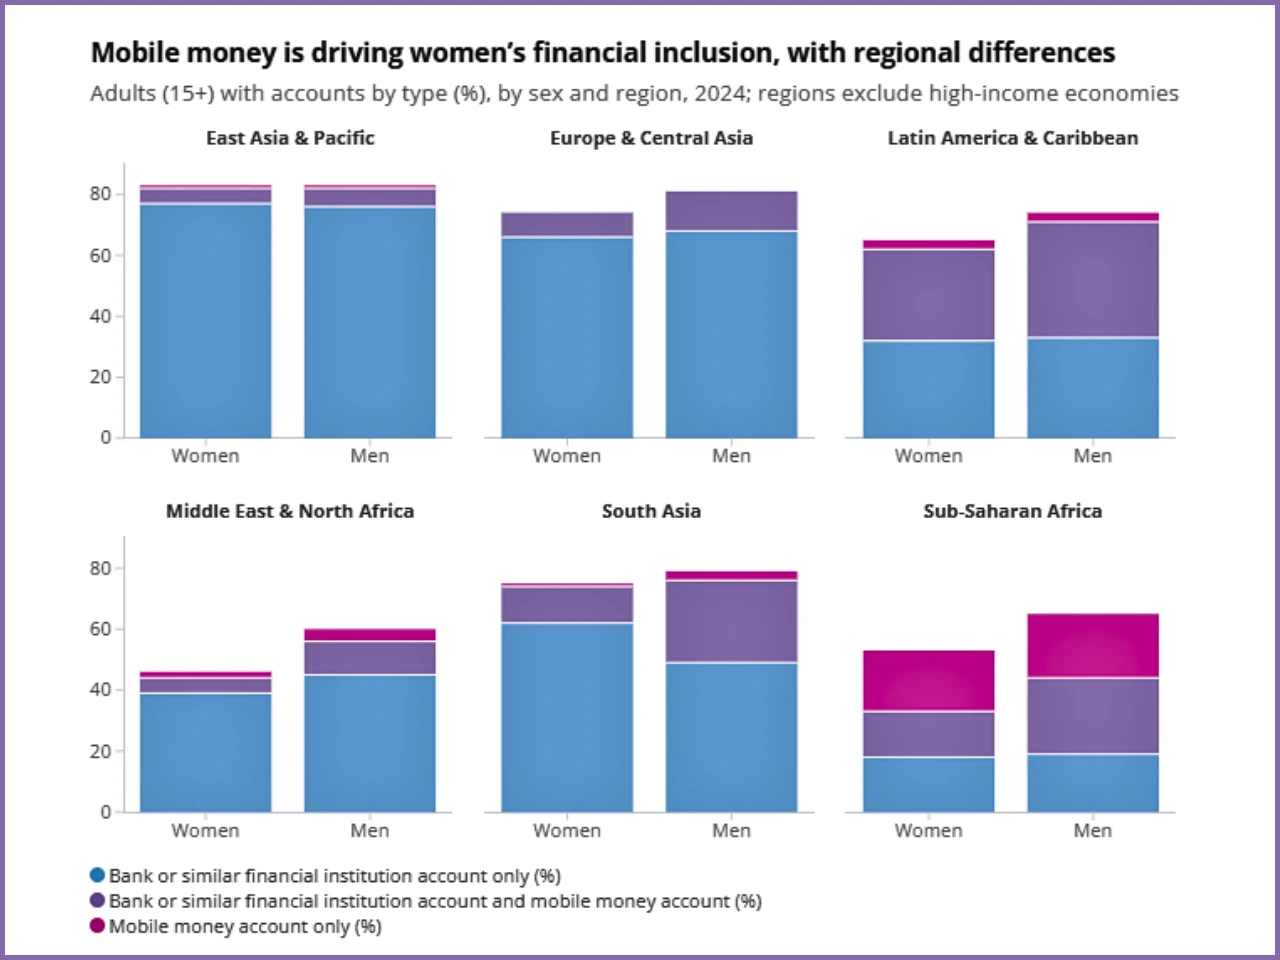
The graph represent women unbanked data
Explained ·May 24, 2026

73% of Women in Low- and Middle-Income Countries Now Own Financial Accounts, But 700 Million Remain Unbanked

Global Findex 2025 data shows women's financial account ownership in low- and middle-income countries rose to 73% in 2024, up from 66% in 2021. Digital payment usage grew from 50% to 58% and formal savings from 22% to 36%, yet over 700 million women remain unbanked. High fees, distance, and limited access to credit continue to hinder full financial inclusion and economic independence.

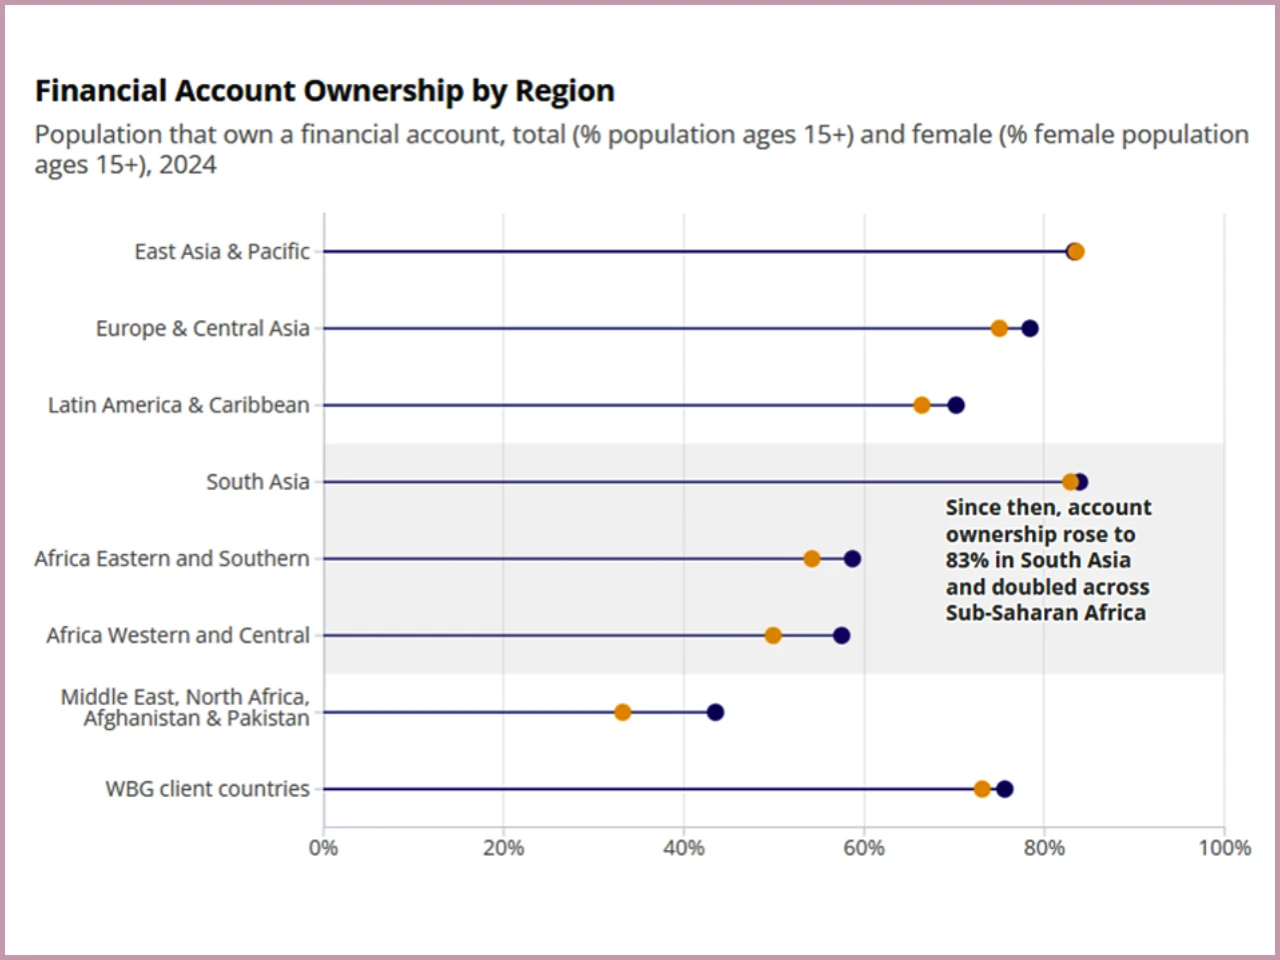
The graph represent financial access
Explained ·May 22, 2026

839 Million in Poverty, Yet 76% Have Financial Access: A Tale of Uneven Progress

The World Bank scorecard reveals mixed global development trends: 839 million in poverty, 76% financial access, and uneven progress in electricity & displacement, highlighting structural weaknesses & need for targeted action. The financial inclusion of women in South Asia is one of the most dramatic, as the number of female account owners increased from 27% to 83%. Aesthetically, the gender gap that used to prevail in the chart has been significantly reduced, which signifies a change in structures and not marginal improvement.This revolution has serious economic consequences. The financial access increases savings behavior, promotes the development of micro-enterprises, increases resilience to shocks, and enhances the bargaining power of women in households.

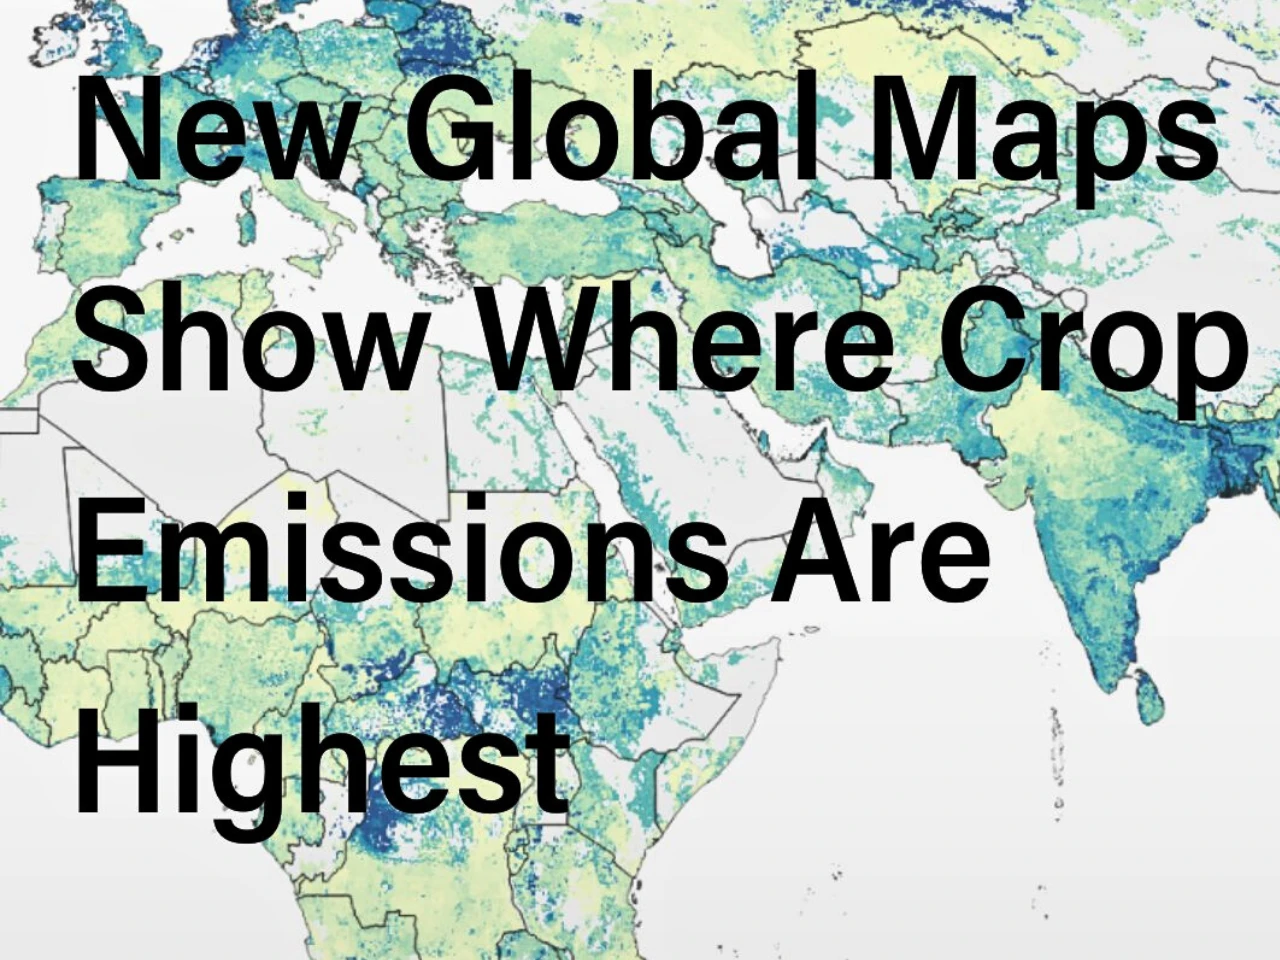
The image represent global map to represent the rop emissions
Explained ·Apr 1, 2026

Crop Emissions Exposed: How Rice, Corn, and Palm Oil Are Heating Up the Planet

Emissions from drained peatlands rose slightly in Southeast Asia, though uncertainties remain in data estimates. Feeding a projected global population of nearly 10 billion by 2050 without sharply increasing emissions presents a critical challenge. Due to staple crops being the building blocks of food security, cultural identity, and livelihoods, replacing these crops is not an option that either makes sense or is desirable. Changes in agricultural practices will be the viable means of advancing. For instance, with rice, mitigation of methane emissions can occur through alternating the permitting of wet and dry periods instead of flooding. Crop residue management (composting or using straw as animal feed) can also contribute to the reduction of greenhouse gas emissions by not burning or incinerating waste products resulting from rice productivity.

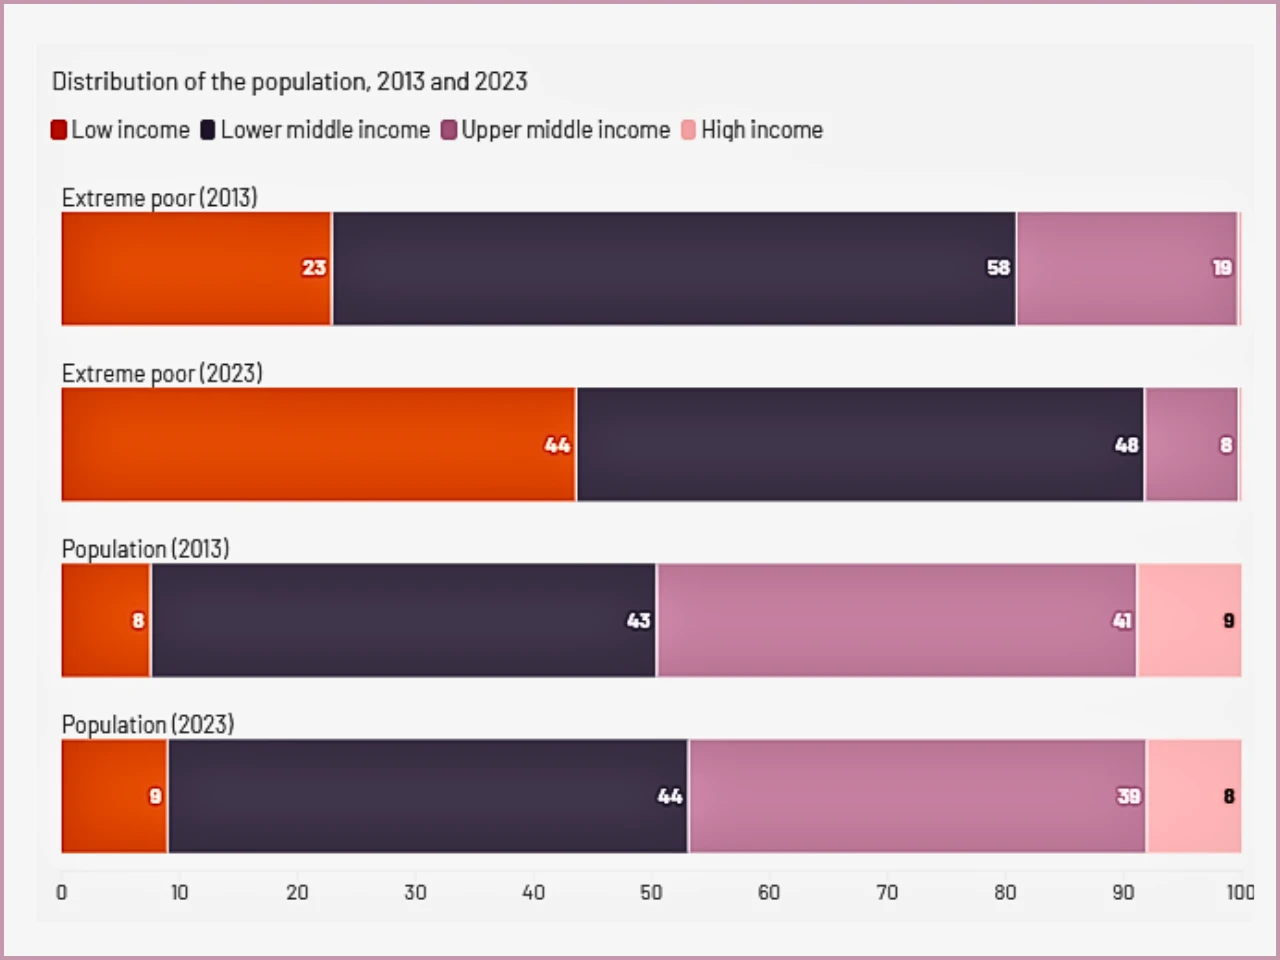
The graph represent distribution of the population, 2013 and 2023
Explained ·Mar 31, 2026

Global Poverty Shifts: Africa, Children Bear Brunt of Extreme Poverty

The percentage of people living in extreme poverty in rural areas of sub-Saharan Africa increased dramatically from 33 percent in 2013 to 53 percent as of 2023. The percentage of the world’s total poor who reside in urban areas of Africa has more than doubled since 2013, despite urban areas of Africa comprising a small proportion of the global population. There has been a significant change in terms of who makes up the population that falls below the poverty line today. More than half (or 46%) of those living in extreme poverty today are less than 15 years of age. This means over 50% of all people living in extreme poverty are children. Despite overall decreases in poverty rates for all age groups, there has been less of a decrease when it comes to youth (age 15 to 24) than with adults (over age 25).

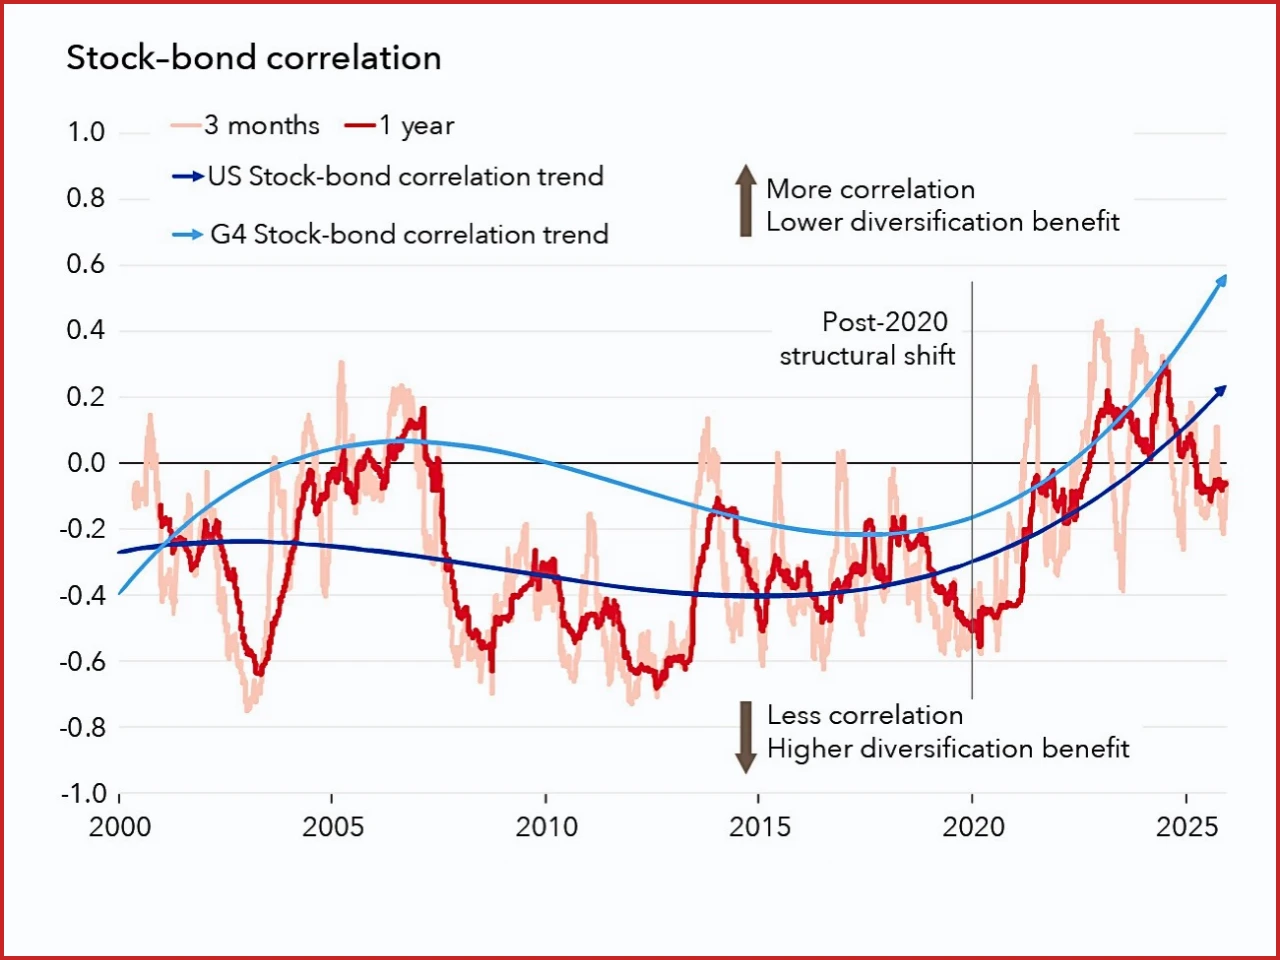
The graph represent the stock and bond correlation in 2000 t0 2025
Explained ·Mar 30, 2026

Stock-Bond Correlation Shift: Is the Traditional Hedge Broken

According to IMF analysis, the stock and bond returns have been trending in the same way, mainly on acute selloffs, since early 2020. Rather than bonds covering the losses of equity, the two asset classes have sometimes declined in tandem, eliminating the diversification advantages. It seems that the shift started towards the end of 2019 and accelerated with the supply shocks prompted by the pandemic, which created global inflation. Statistics provided by the IMF indicate the presence of a structural break. In the pre-pandemic past, the correlation between equities and government bonds rolled negatively in the majority of cases. In 2020, the trend of the correlations was positive and often had a positive value.

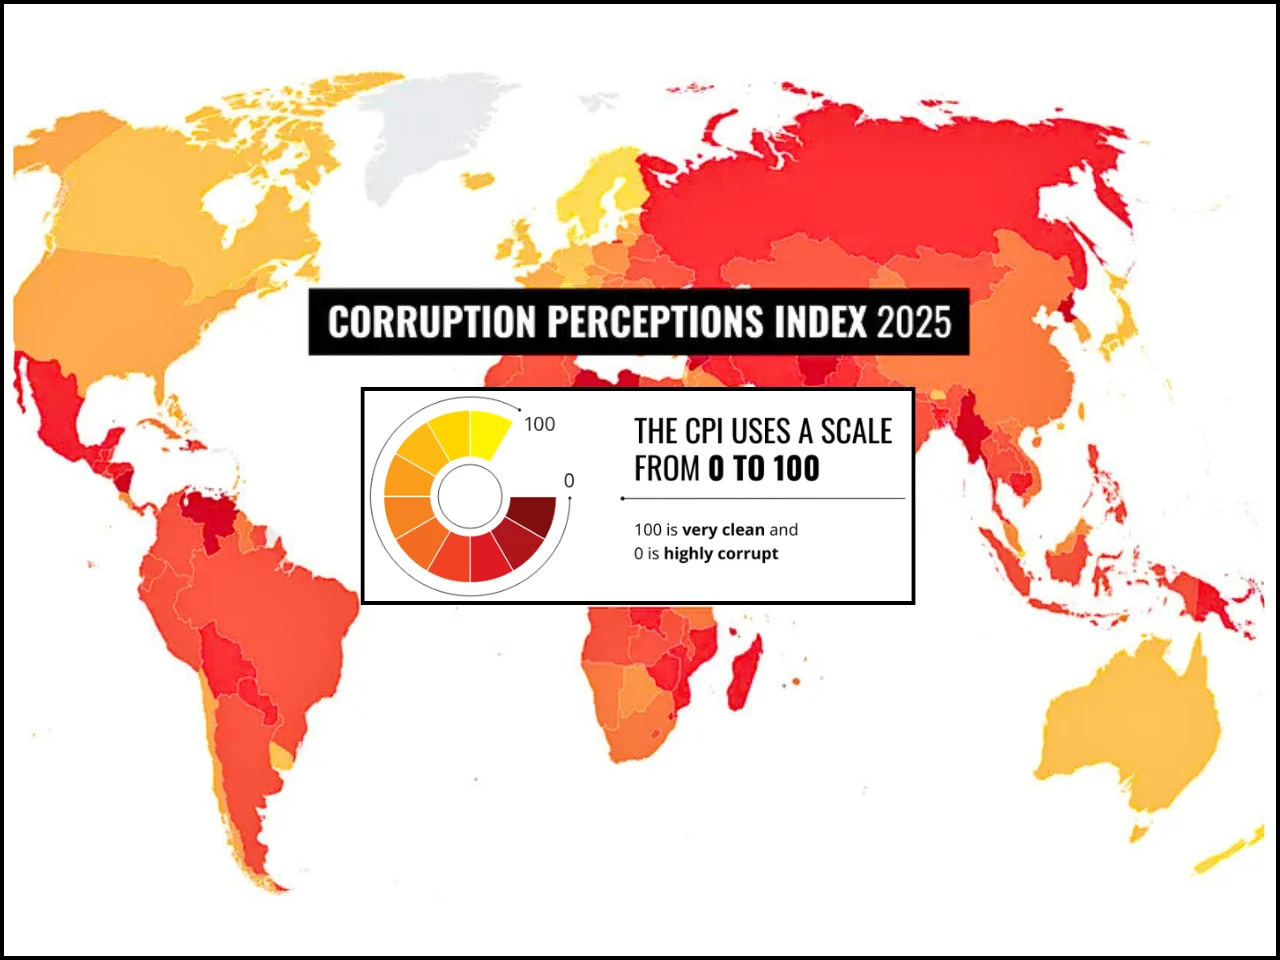
the image represent the Corruption Perceptions Index rport 2025
Explained ·Mar 29, 2026

Global Corruption Hits Decade-Low: CPI 2025 Report Sounds Alarm on Governance

Over two-thirds of the nations had a score of below 50, meaning they were facing serious corruption issues in huge portions of the world. Nordic and highly institutionalized democracies still dominate at the top of the index. Denmark was ranked first with a score of 89, and this has followed a long track of good performance in governance. Other advanced nations are Finland, Singapore, and New Zealand, which are known to have a good reputation in terms of good institutions and open administration. On the other extreme, the least scored are conflict-affected and politically unstable states. There were the lowest scores in such countries as Somalia and South Sudan, where institutions are weak, and the crises of governance continue.

Electricity Demand Surges: Global Consumption Set to Skyrocket in the 'Age of Electricity
Explained ·Mar 28, 2026

Electricity Demand Surges: Global Consumption Set to Skyrocket in the 'Age of Electricity'

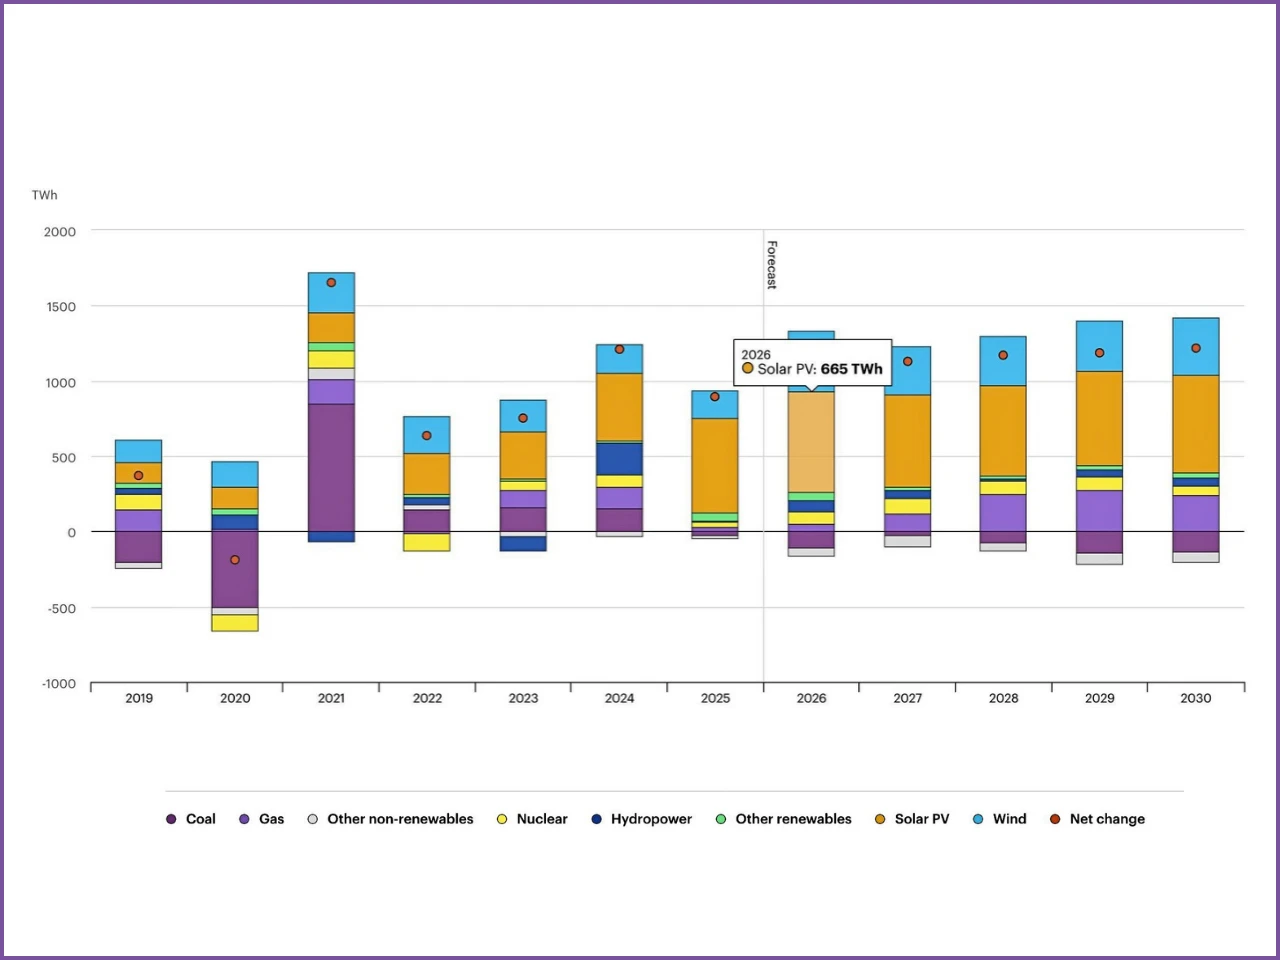
Global electricity consumption is entering a period of sustained and accelerated expansion, marking what many describe as the “Age of Electricity.” Between 2026 and 2030, worldwide electricity demand is projected to grow at an average annual rate of 3.6%, significantly faster than in the previous decade. This surge is driven by rising industrial production, rapid adoption of electric vehicles, expanding use of air conditioning, and the proliferation of data centers supporting digitalization and artificial intelligence. After increasing by 4.4% in 2024 and 3% in 2025, annual demand growth over the next five years is expected to be roughly 50% higher than the average recorded over the past decade.

Global Economy: Stable Growth, Unequal Recovery
Explained ·Mar 27, 2026

Global Economy: Stable Growth, Unequal Recovery

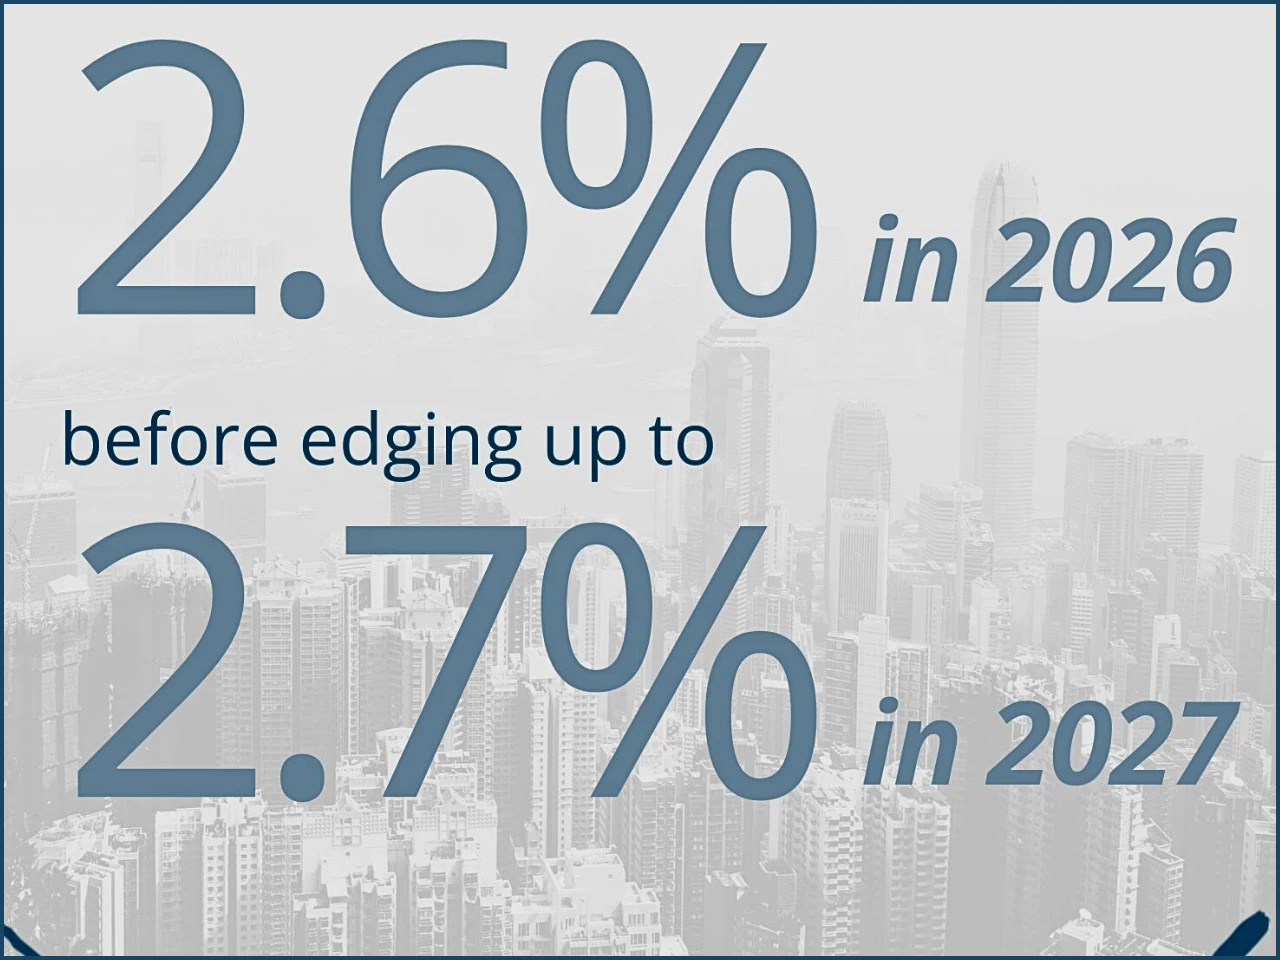
The report Global Economic Prospects, January 2026, indicated that the global economic growth is expected to reach a stable level of 2.6 percent in 2026, but it will increase to 2.7 percent in 2027. Although these numbers indicate a gradual upward trend in recovery, they also highlight a dispiriting truth that the benefits of such recovery are not being evenly distributed between regions and income groups. The report also highlights that the world economy has been able to escape deep economic downturns despite the dislocation in global trade and inconsistent investment climates. The global economy is growing, as the projections show that 2026 and 2027 will experience growth, although at a lower rate compared to the trends that were experienced before the pandemic.

Global Agricultural Prices to Stabilize in 2026, But Uncertainty Looms
Explained ·Mar 26, 2026

Global Agricultural Prices to Stabilize in 2026, But Uncertainty Looms

World Bank Group forecasts indicate the agricultural price index is projected to drop about two percent by 2026. This lower price forecast balances projected supply increases versus projected demand increases, with the net effect of the expected overall risks to the global commodity markets on average likely to be offsetting. Prices for food and agricultural raw materials are expected to remain stable across most commodities as anticipated production increases will be comparable to increases in consumption. In contrast, beverage prices, particularly coffee and cocoa, are expected to decline approximately seven percent, primarily as a result of expanded production levels. Although overall price movements appear under control, the forecast will remain vulnerable to weather variability, broader macroeconomic conditions and trends, trade-related policy issues, and input cost changes.

Global Survey Reveals Mixed Adoption of AI in Developing Countries
Explained ·Mar 25, 2026

Global Survey Reveals Mixed Adoption of AI in Developing Countries

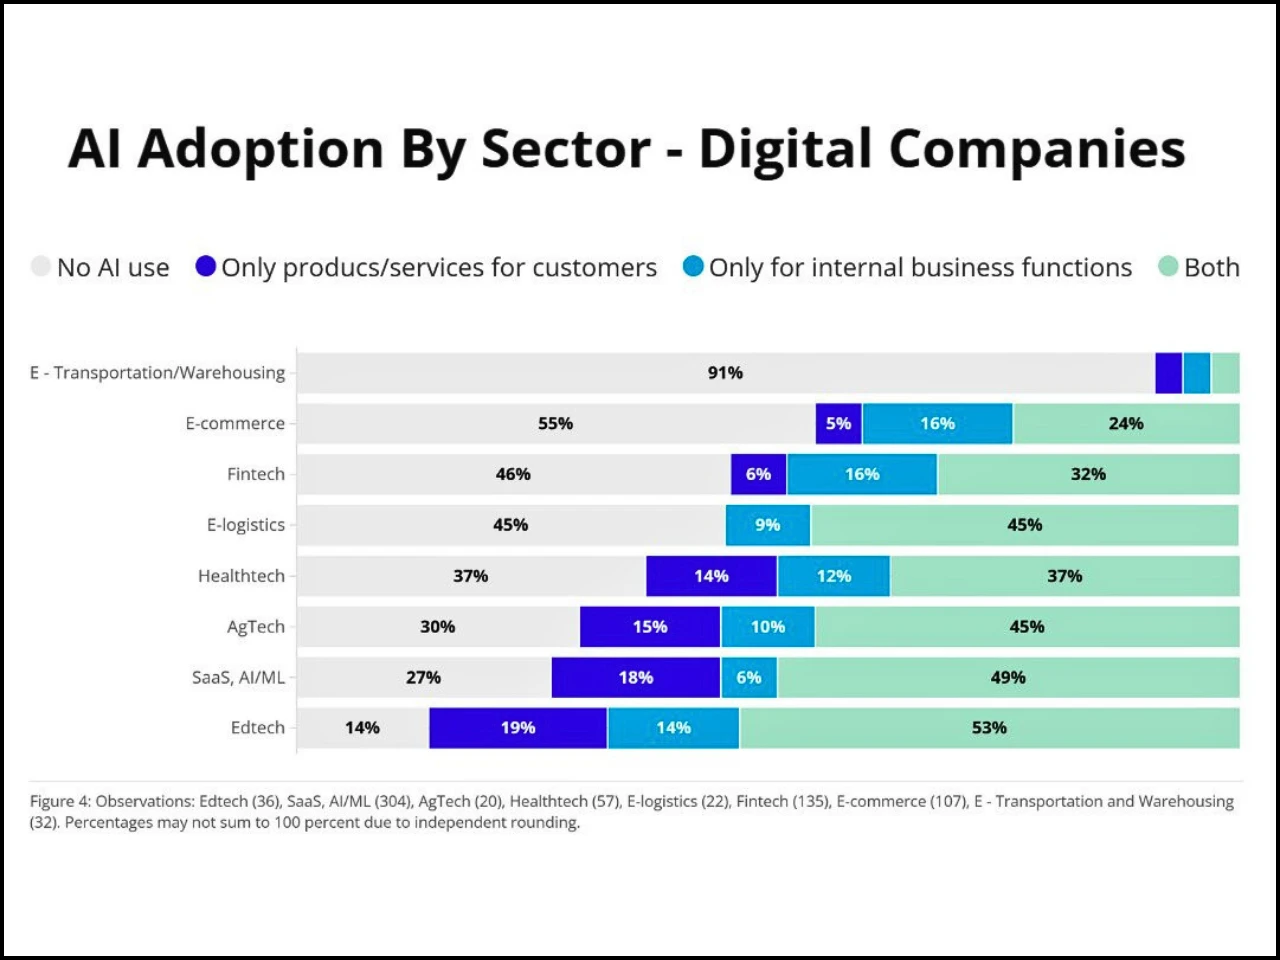
The survey's results offer readers a first view of AI usage globally for developing economies with limited uptake (e.g., a few early adopters piloting), while most businesses have no actual engagement with AI systems. The intensity of AI usage across firms that implement AI varies immensely. Less than 25% of the companies polled rely only on AI for outreach and external operations, and less than 25% utilize it entirely for core functions. Conversely, approximately 25% use AI internally and externally, demonstrating a greater degree of integration and utilization of AI across multiple areas of business. Companies that embed AI into multiple activities will have a much greater chance of realizing cumulative productivity improvements and greater business value than those that use AI in isolation or for very narrow purposes alone.

Frontier Markets: A Tipping Point for Global Development
Explained ·Mar 24, 2026

Frontier Markets: A Tipping Point for Global Development

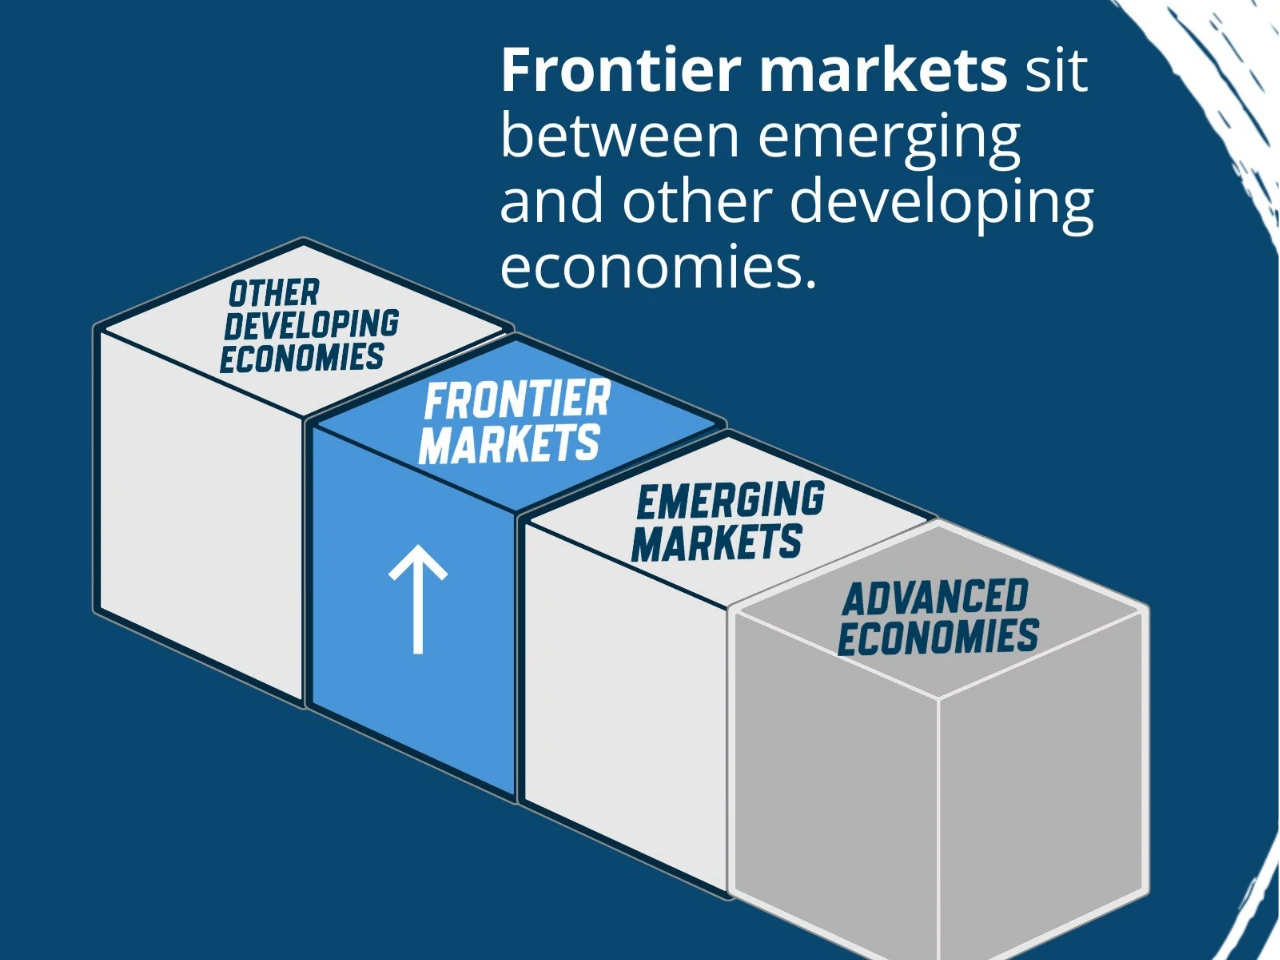
New analysis in the World Bank Global Economic Prospects (GEP) 2026 report shows that frontier markets present huge potential and a huge threat to the global economy. With almost 1.8 billion inhabitants, approximately a fifth of the global population, the frontier markets at present contribute approximately 5 percent of the global gross domestic product. Although this is a small percentage, their population impact is still growing fast. The report points out that frontier markets have a number of structural advantages. Most of these economies are well endowed with natural resources such as minerals needed in the global energy transition. They usually have relatively better institutions, healthier populations, and better-educated workforces compared to the other developing economies.